CalcGen AI
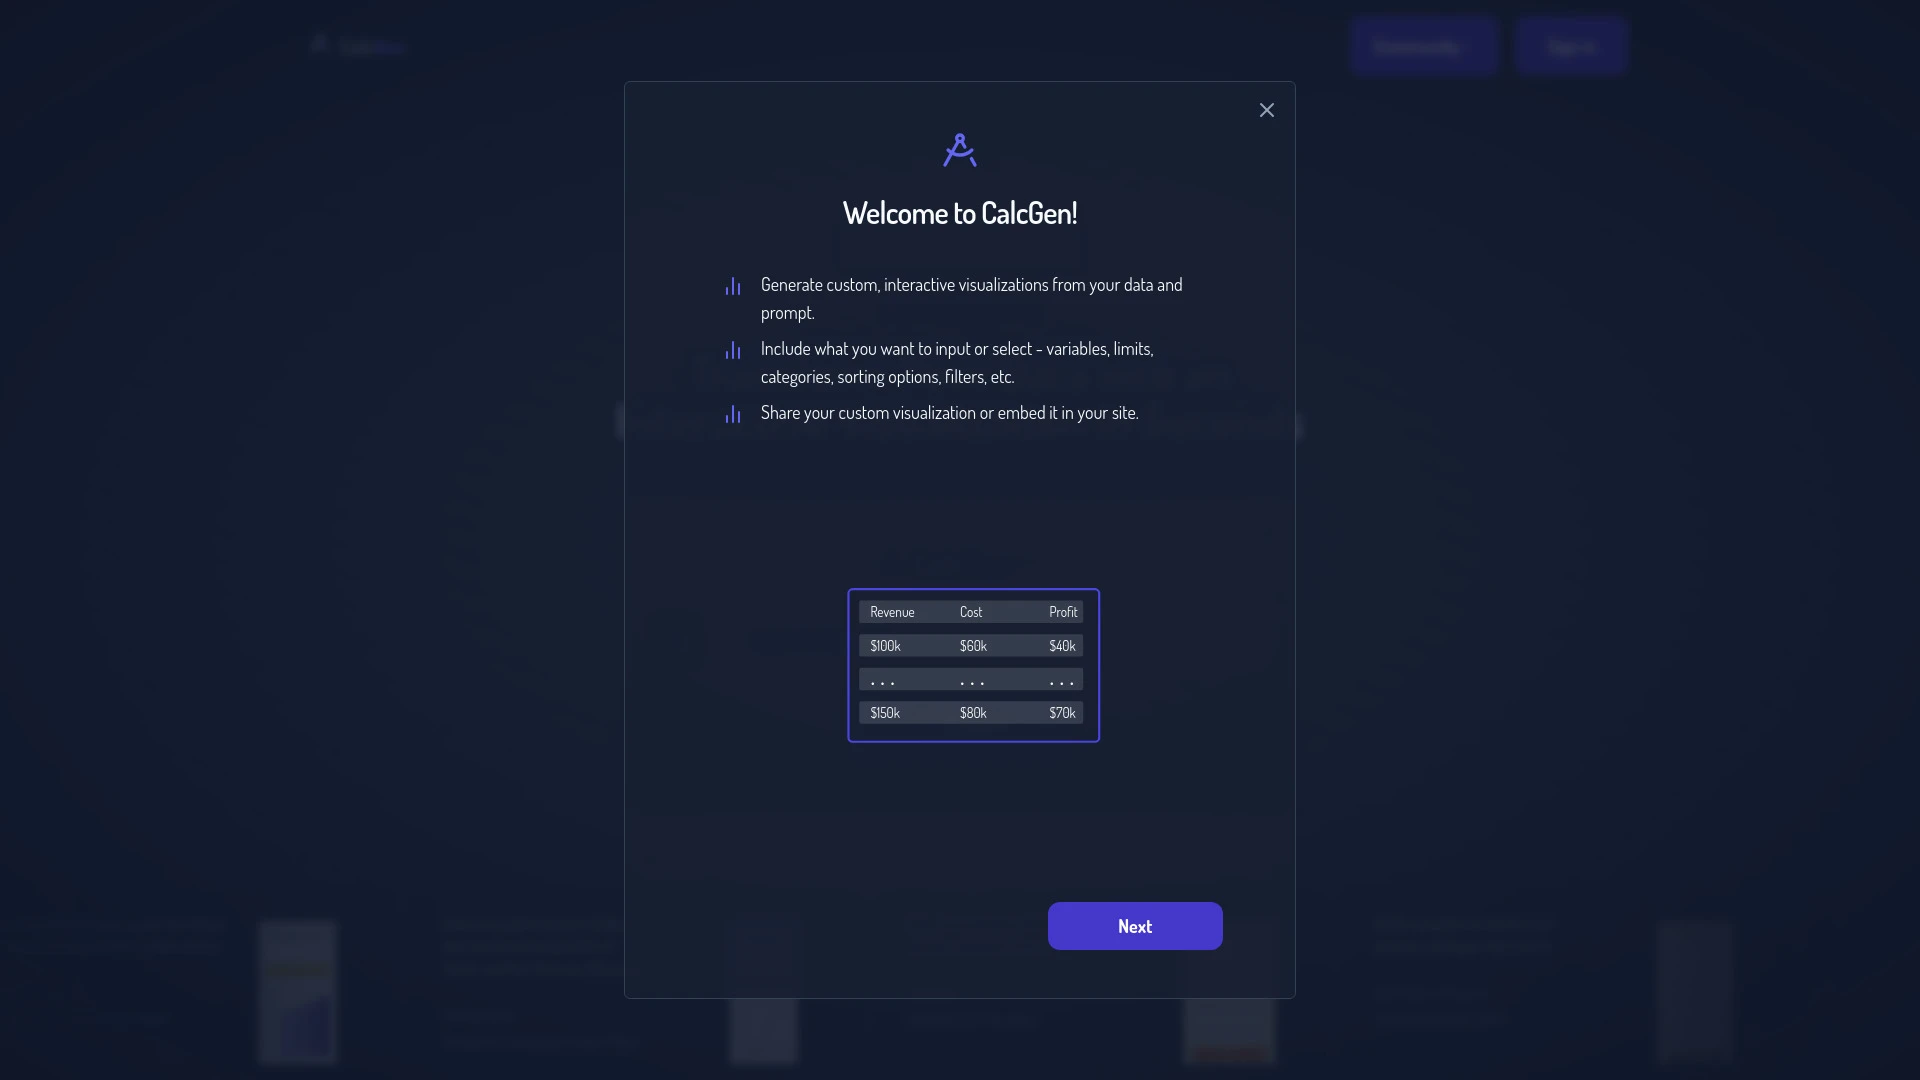
CalcGen AI is a user-friendly tool for creating interactive charts, graphs, and calculators powered by AI.
Primary AI
Top Job for This AI
Most Commonly Used Task
Product Information
What is CalcGen AI?
CalcGen AI offers an intuitive interface for users to effortlessly generate interactive visualizations and calculations. By simply describing the data or calculation needs, users are provided with fully customizable charts and calculators that can meet various analytical requirements. Whether for academic, financial, or personal use, CalcGen AI enhances data interpretation and presentation, making complex information accessible through clear graphical formats.
Core Features
Interactive charts and graphs
Customizable calculators
Data visualization from various inputs
Embedding options for websites
User-friendly interface
Quick setup and generation
Advantages
Use Cases
Generate graphs comparing financial performance across multiple metrics
Create calculators for scientific formulas like ideal gas law and compound interest
Visualize survey results
Draft interactive presentations
Support data analysis in academic projects
Frequently Asked Questions
What types of visualizations can CalcGen AI create?
CalcGen AI can create various types of interactive charts and graphs including line charts, bar charts, pie charts, and more.
Do I need to upload my data to use CalcGen AI?
No, you can simply describe the data you want visualized or the calculator you need, and CalcGen AI will generate it without requiring data uploads.
Can I embed the charts created with CalcGen AI?
Yes, CalcGen AI provides options to embed the generated charts and calculators directly into your website.
Reviews
Primary Tasks For CalcGen AI
| # | Task | Popularity | Impact | Follow |
|---|---|---|---|---|
| 1 |
📊
Data visualization |
56% Popular
|
78% Impact
|
|
| 2 |
🤖🔍
AI content detection |
100% Popular
|
87% Impact
|
|
| 3 |
📚🎮
Interactive learning |
52% Popular
|
76% Impact
|
|
| 4 |
🎮
Interactive gaming |
76% Popular
|
75% Impact
|
|
| 5 |
📊
Data analysis |
60% Popular
|
85% Impact
|
|
| 6 |
📊
Spreadsheet tasks |
52% Popular
|
78% Impact
|
|
| 7 |
📖✨
Interactive storytelling |
96% Popular
|
87% Impact
|
|
| 8 |
📊
Presentation slides |
76% Popular
|
85% Impact
|
|
| 9 |
💻
Coding assistance |
84% Popular
|
87% Impact
|
|
| 10 |
🤖
Chatbots |
88% Popular
|
87% Impact
|
|
| 11 |
🖥️
User interfaces |
56% Popular
|
78% Impact
|
|
| 12 |
📊
Database QA |
48% Popular
|
78% Impact
|
|
| 13 |
🧠
Quizzes |
72% Popular
|
72% Impact
|
|
| 14 |
💡
Idea generation |
48% Popular
|
75% Impact
|
|
| 15 |
✂️🎬
Video editing |
40% Popular
|
75% Impact
|
